

Regarding the use of a digital input/output buffer information specification (IBIS) simulation model in the development phase of a printed circuit board (PCB). This article describes how to use the IBIS model to extract some important variables for signal integrity calculations and determine PCB design solutions.
Please note that this extracted value is an integral part of the IBIS model.
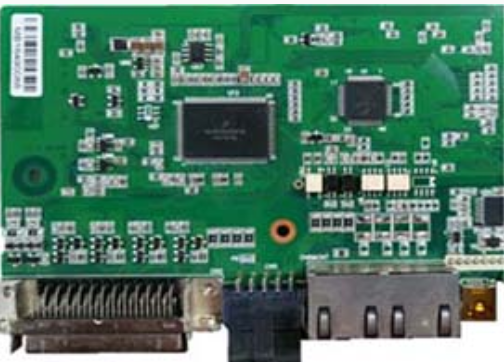
Signal integrity issues When observing digital signals at both ends of a transmission line, designers will be surprised by the results when the signal is driven to the PCB trace. In the case of a relatively long distance, the electrical signal is more like a traveling wave rather than an instantaneous change signal. A good simulation of the behavior of waves on a circuit board is CHICHENGPO (waves in a pool). Since the two groups of the same volume of water have the same "impedance", the ripple passes smoothly through the pool. However, the impedance difference of the cell wall is obvious, and the waves are reflected in the opposite direction. The electrical signal injected into the PCB trace will have the same phenomenon. When an impedance mismatch occurs, this phenomenon is reflected in a similar way. Figure 1 shows a PCB device with mismatched end impedance. The microcontroller TI MSP430™ sends a clock signal to the TI ADS8326 ADC, which sends the conversion data back to the MSP430. Figure 2 shows the reflections caused by impedance mismatches in the device. These reflections cause signal integrity problems on the transmission line traces.

Allowing PCB trace resistance matching at one or both ends can greatly reduce reflections.
f In order to solve the problem of system resistance and resistance matching, designers need to understand the impedance characteristics of integrated circuits (ICS) and the impedance characteristics of PCB traces that act as transmission traces.
After understanding these functions, designers can model each connection unit as a distributed transmission line. Transmission lines provide various circuit services, from single-ended and differential terminal equipment to open-drain output equipment. This article mainly introduces the single-ended transmission line, the driver of which has a push-pull output circuit design.
In addition, the following IC PIN specifications are required:
Transmitter output resistance ZT (Omega)
Transmitter rise time tRise and fall time tFall (seconds)
Receiver input resistance ZR (Omega)
Receiver pin capacitance value CR_Pin (F) These specifications are usually not in the IC manufacturer's product manual.
As will be discussed in this article, all of these values can be obtained through the IC's IBIS model during PCB design and use the model to simulate the PCB transmission trajectory.
Use the following parameters to define transmission tracking:
Characteristic impedance Z0 (Omega)
Propagation delay D (ps/inch)
Tracking propagation delay tD (PS)
Tracking length LENGTH (inches) Depending on the specific PCB design, the variable list may be longer. For example, the PCB design can have a backplane with multiple transmission/reception points. 3 All transmission line routing depends on the specific PCB. Generally, the Z0 range of the FR-4 board is 50 to 75 ohms, and the D range is 140 to 180ps/inch. The actual values of Z0 and D depend on the material and physical size of the actual transmission track.
4 The line propagation delay of a specific circuit board can be calculated as follows: TD = dxlength.
(1) For the FR-4 board, the reasonable propagation delay of the linear line (see Figure 4) is 178 ps/inch, and the characteristic impedance is 50 ohms.
By measuring the wire inductance and capacitance of the trace and inserting these values into the following formula, we can verify this result on the circuit board: CTR is a wire-speed tracking line capacitance in farads/inch; LTR is for enjoyment/inch The unit of line inductance; ps/inch is the dielectric constant of air; and ER is the dielectric constant of the material.
For example, if the microwave transmission strip board line capacitor is 2.6pF/inch, the line inductance is 6.4nH/inch, and D=129ps/inch, Z0=49.4Ω.
Comparison of Aggregate Circuits and Distributed Circuits Once the transmission line has been defined, the next step is to determine whether the circuit layout represents an aggregated system or a distributed system. Generally, the size of the aggregation system is small, and the distributed circuit requires more board space. The small circuit has an effective length (LENGTH), and its signal is smaller than the fastest electrical characteristic.
To be a qualified aggregation system, the circuit on the PCB must meet the following requirements:
(5) Among them, tRise is the rise time in seconds. After the aggregation circuit is implemented on the PCB, the termination strategy is not a problem.
Basically, we assume that the drive signal transmitted to the transmission line reaches the receiver immediately.
The data organization structure of the IBIS model is based on the power supply voltage range of the IC. The IBIS model includes three or six or nine corner data. The variables that determine these angles are silicon process 1, power supply voltage, and junction temperature. The specific process/voltage/temperature (PVT) SPICE angle of the device model is critical to creating an accurate IBIS model. The ratings are different, the silicon process is different, and the models created are weak and strong. The designer defines the voltage setting according to the power requirements of the component, and changes it between the rated value, the minimum value and the maximum value.
Finally, according to the component's rated temperature range, rated power consumption and the junction of package and environmental thermal resistance, that is, θJA, determine the temperature setting of the component's silicon junction. Table 1 provides examples of three PVT variables and their relationship with TI's 24-bit biopotential measurement ADC ADS129x series CMOS process. These variables are used to implement six SPICE simulations. The first and fourth simulations used the rated process model, rated power supply voltage and junction temperature at room temperature. Both the second and fifth simulations use a weak process model, low supply voltage and high junction temperature. The third and sixth simulations use powerful process models, higher supply voltages and lower junction temperatures.
The relationship between the PVT values maps the optimal angle of the CMOS process.
Find and/or calculate the transmitter specifications The specified transmitter specifications for signal integrity evaluation include output impedance (ZT) and rise time (tRise and tFall, respectively). Figure 5 shows the TI ADS1296 package ads129x.ibs, which lists the self-IBIS model files. 5 The value used to generate the impedance is shown under the [Pin] keyword, which is also in the buffer model (not shown).
The boost time is located in the transient part of the IBIS model data list. Impedance of input and output pins The pin impedance of any signal is added to the model impedance by the package inductance and capacitance. In Figure 5, the keywords "[Component]", "[Manufacturer]" and "[Package]" describe a specific package, 64-pin PBGA (ZXG). The package inductance and capacitance of a specific pin can be found under the "[Pin]" keyword. For example, at pin 5E, you can find the signal GPIO4, L_pin and C_pin values.
The L_pin (pin inductance) and C_pin (pin capacitance) values of the signal and package are 1.4891 nH and 0.28001 pF, respectively. The second important capacitance value is the silicon capacitor, namely C_comp. The C_comp value can be found under the "[Model]" keyword in the model DIO_33 list of the Ads129x.ibs file (see Figure 6). C_comp in this model is the capacitance of the DIO buffer, and its power supply pin voltage is 3.3V. The "|" symbol represents a comment; therefore, the effective C_comp value of this list is 3.0727220e-12 F (typical value), 2.3187130e-12 F (minimum) and 3.8529520e-12 F (maximum), PCB designers can Choose from them.
Using IBIS to design transmission lines In this article, a PCB with mismatched end impedance is discussed as a starting point. After that, the PCB factory learned through the IBIS model and found some key components of this transmission problem. In this regard, there should be a solution to this problem.
Display the termination correction strategy and display the corrected waveform. If you want to design a PCB transmission line, the first step is to gather information from the PCB product manual. The second step is to check the IBIS model and find some parameters that cannot be obtained from the specification input/output impedance, boost time, and input/output capacitance. When entering the hardware stage, we need to use the IBIS model to find some key product specifications and simulate the final design.